31 CLIMATE CHANGE: EVIDENCES AND CAUSES
Dr. Subhakanta Mohapatra

Contents
Introduction
Learning Objectives
Defining Climate Change
Global Change and Climate Change
Sources of Climate Change
Natural Sources of Climate Change
Solar Variability
Changes in Earth’s Orbit and Tilt
Plate Tectonics
Biological Evolution
Climate Change due to Anthropogenic Activities
Scientific Studyto Establish Human Induced Climate Change Global Warming andAnthropogenic Activities
How do Human Activities Contribute to Climate Change Carbon dioxide
Methane
Nitrous oxide
Halocarbon
Sources of Evidences about Climate Change
Evidences of Climate Change
Increasing Temperatures over Land and Ocean Surfaces Melting of Glacial and Sea Ice Rising Sea-Level
Increasing Humidity and Extreme Events Observations of Changes in Climate at Global Level Observations of Changes in Climate at National Level Summary and Conclusions
References
Web Links
Multiple Choice Questions
Answers to MCQs
Introduction
We experience or hear about intense storms, frequent floods, severe drought, melting andreceding glaciers etc. and the list goes on. You might have also read or heard that climate change is being cited as the major reason for such extreme events. For several years, global warming or climate change was considered as ‘sceptics’ argument. But, today it has been accepted as a reality. This was possible due to the significant contribution made by various scientists engaged in climate science research. Since theformation of Inter-Governmental Panel on Climate Change (IPCC) a concerted effort has been made to compile researches conducted across the globe on human induced climate change. Till now, IPCC has produced five Assessment Reports that provides latest scientific advancement in this area. This has also provided guidelines for policy makers for future.
In this module, we shall studyclimate change and describe various natural as well as human induced factors responsible for climate change. This would be followed by corroborating scientific evidences about human induced climate change. We will also discuss about the probable consequences and impacts of climate change both at global as well as at national level.
Learning Objectives
After reading this module, you will be able to:
- define climate change;
- explain natural and human induced factors responsible for climate change;
- Describe various evidences of climate change and their sources;
- describe the adverse impact of human activities on climate change; and
- analyse the probable consequences and impact of climate change at global as well as national level.
Defining Climate Change
In simpler terms, climate change may be expressed as any substantial change in the Earth’s climate that lasts for an extended period of time. Normally, minimum thirtyyears’ time period are being considered for analysing or predicting any climatic condition of a place. Two major elements of climate are temperature and precipitation.According to the Inter-Governmental Panel on Climate Change (IPCC), climate change refers to
“any change in climate over time, whether due to natural variability or as a result of human activity” (IPCC, 2001a).
The United Nations Framework Convention on Climate Change (UNFCC) in Article 1defined it as:
“climate change refers to a change in climate which is attributed directly or indirectly to human activity that alters the composition of the global atmosphere and which is in addition to natural climate variability observed over comparable time period” (IPCC, 2001a).
Global Change and Climate Change
Today, there are lots of discussions on global change issues rather than merely discussing about climate change. While talking about climate change, there is a need for a discussion on global change for two reasons:
1) Climate change is one among many global changes that has been affecting the earth.
2) Climate change has been affecting and has been affected by many of the global change phenomena.
Global change is a transformation that occurs on a worldwide scale e.g., an increase in carbon dioxide in the atmosphere or exhibits sufficient cumulative effects to have worldwide impact e.g. local species extinction resulting in global loss of biodiversity. In the past, the main drivers of global change have been solar output, plate tectonics, volcanism, proliferation and abatement of life, resource depletion, changes in Earth’s orbit around the sun and changes in the tilt of Earth on its axis. There is increasing evidence that, now the main driver of global change, is the growing human population’s demand for energy, food, goods and services, and disposal of its waste products. In the last 250 years, global change has caused climate change, widespread species extinctions, fish-stock collapse, desertification, ocean acidification, ozone depletion, pollution, and other large-scale shifts.
Sources of Climate Change
Do you know climate change had happened many a times on the Earth’s history since itsorigin? Then, you must be thinking that why we are making so much hue and cry about this. This is because climate change in today’s context is anthropogenic or in simpler term created by human activities. Evidences suggest that earlier climate change occurred due to natural processes. Therefore, in the beginning of the module we will discuss briefly about various natural sources responsible for climate change during different geological periods of earth’s history. We will also discuss in details climate change due to anthropogenic activities that have been taking place in recent times.
The sources or the causes for climate change could be grouped into two:
- natural and
- anthropogenic
Natural Sources of Climate Change
Some of the factors mentioned below are responsible for long term climate change whereas others are responsible for short term climate change. Major natural sources of climate change aresolar variability, changes in Earth’s orbit and tilt, plate tectonics and biological evolution.
Let us discuss briefly above mentioned factors one by one.
Solar Variability: This happens due to variation in solar energy output. You might have read that the energy output of the sun varies slightly over time. This has been measured by the data obtained through satellite.The variation in the total output has been observed both throughout the day as well as during the solar cycle. These variations can directly affect Earth’s climate.But the exact role that solar variability plays is still a controversial and not unanimously accepted by the scientific community.
Changes in Earth’s Orbit and Tilt:This was another major natural source responsible for climate change. You might have read thatearth generally changes its orbit over a 100,000-year cycle.It normally shifts from almost a circular to elliptical orbit. This has led to changes in the tilt of Earth’s axis between 21.8 and 24.4 degrees.As a result of which there has been change in the planet’s solar energy budget.In other words, there used to be a change in the amount of solar radiation that different areas of the Earth receive. The northern hemisphere is now closer to the sun in winter and farther away in summer. As a result of which it receives five percent less sunlight in summer than 12,000 years ago. More tilt leads to greater seasonal variations. This is known as Milankovitch cycle (Refer to Figure 1). Milankovitch was a Serbian geophysicist and astronomer who theorized this above mentioned phenomena.
Figure 1: Climate Change due toChanges in Earth’s Orbit and Tilt

Source:https://www.windows2universe.org/earth/climate/images/milankovich_lg.gif
Plate Tectonics: As a geography student, you might have read about continental drift and plate tectonic theory in your course on Physical Geography or specifically in geomorphology. As described by both the theories, millions of years ago most of the Earth’s land mass was a single continent known as Pangea and surrounded by one huge water bodies known as panthalas. Over time, portions of it drifted apart, gradually forming the continents and ocean basins existing today. The redistribution of land mass and ocean area has had a major effect on global climate.
Biological Evolution: This natural process took place mainly during the evolution of photosynthetic organism. Do you know that several billion years ago Earth’s pre-life atmosphere was mainly covered by carbon dioxide and methane? The gradual shift in the atmospheric concentrations fromcarbon dioxide and methane to nitrogen and oxygen took place because photosynthetic organisms consumed carbon dioxide and generated oxygen.
Climate Change due to Anthropogenic Activities
As mentioned in the beginning of the module, today’s climate change is primarily due to anthropogenic activities. But, do you know how we have arrived on such conclusion? There was lots of scientific research that took place over the last two hundred years that helped in concluding about the present climate change is due to anthropogenic activities. Let us discuss these scientific developments in brief.
Scientific Studyto EstablishHuman Induced Climate Change: As we know,today’s climate change is due to presence of excessive greenhouse gases in the atmosphere due to human activities. This led to increase in temperature on the earth surface due to greenhouse effect. Do you know the scientist who identified the problem created by greenhouse effect? The French mathematician, Joseph Fourier highlighted the greenhouse effect. Fourier realized that the earth’s temperature is determined not only by the radiation absorbed by, and emitted from the earth, but also by the existence of the atmosphere. The atmosphere absorbs some of the radiated heat and acts as a blanket over the Earth that maintains the temperature higher than it would otherwise be.
The next major breakthrough was made in 1860 by the British scientist John Tyndall in terms of measuring the absorption of radiation by different gases. This led to the remarkable discovery that the most prevalent gases in the atmosphere i.e. oxygen and nitrogen weren’t absorbing any of the energy at all. Only the minor gases in the atmosphere, i.e., carbon dioxide (CO2), methane (CH4), nitrous oxide (N2O) and water vapour, were doing so. These gases are called greenhouse gases (GHG).
The Swedish scientist, Svante Arrhenius was the first person to estimate the extent to which increases in atmospheric carbon dioxide increase Earth’s surface temperature. This is also known as Arrhenius effect. Presently, studying climate system is much more advanced due to the advancement in information and communication technology aided by space technology.
Global Warming andAnthropogenic Activities: Till now, you might have realised that global warming is most commonly associated with human interference, specifically the release of excessive amounts of greenhouse gases. These gases, act like a greenhouse around the earth. This means that these gases allow the heat from the Sun to enter into the atmosphere, but do not allow the heat to escape back into space. In other words, more increase in the greenhouse gases, the larger is the percentage of heat trapped inside the earth’s atmosphere. You might be knowing that the earth would have not beeninhabitablewithout the presence of some naturally occurring greenhouse gases (GHG). This is because without these gases, no heat would be trapped in the atmosphere, so the earth would be extremely cold. It is estimated that the average temperature of the earth would be about -170C without greenhouse effect which is not at all the condition for the growth of biota. Naturally occurring greenhouse gases (not fluorinated gases) are good in naturally occurring amounts; it’s when people start contributingexcessive amounts of these that greenhouse gases become a problem. With excessive greenhouse gas build-up, the earth’s atmosphere warms to unnatural temperatures.
Let us understand how various human activities contribute in increasing these GHGs.
How do Human Activities Contribute to Climate Change? Different anthropogenic activities lead to emissions of four principal greenhouse gases: carbon dioxide, methane, nitrous oxide and the halocarbons (a group of gases containing fluorine, chlorine and bromine). These gases accumulate in the atmosphere and have been increasing with the passage of time. The most significant aspect about the increases in all of these gases is that they have occurred in the industrial era which is not more than 300 years old. This is because of influence of human activities particularly in recent centuries. Itis so significant that it has been affecting allthe living organisms on the earth.
Carbon dioxide has been increasing from the utilization of fossil fuels in transportation, building heating/ cooling and in the manufacture of cement and other goods. Deforestation releases CO2 and reduces its uptake by plants. Carbon dioxide is also released in natural processes such as the decay of plant matter.
Methane has increased as a result of human activities related to agriculture, natural gas distribution and landfills. Methane is also released from natural processes that occur, for example, in wetlands.
Nitrous oxide is emitted by human activities such as fertilizer use and fossil fuel burning.
Natural processes in soils and the oceans also release N2O.
Halocarbon gas concentrations have increased primarily due to human activities. Principal halocarbons include the chlorofluorocarbons (e.g., CFC-11 and CFC-12), which were used extensively as refrigeration agents and in other industrial processes before their presence in the atmosphere was found to cause stratospheric ozone depletion.
We will discuss in detail about these gases and their major sources in the next module which exclusively discuss about role human being on climate change.
Sources of Evidences about Climate Change
When we discuss about the science of climate change we generally look for evidences and causes responsible for climate change. As a result of which the scientific community including geographers look for three key elements. These three key elements are “the study of past climates, the measurement of current climate change and the modelling and projections of future climate scenario.” (Christopherson and Birkeland, p. 316)
Scientists all over the world have been systematically compiling and analysing different climate related parameters to ascertain about the changing climate. They have also made an attempt to ascertain that the present climate change is human induced. The IPCC, since its inception in 1988 has been working as the international scientific organization coordinating global climate change research, climate forecasts, and policy formulation by engagingin collaboration of scientists and policy experts from many disciplines across the globe. Therefore, this assertion is based on certain facts rather than any speculation or politically motivated. Some of the sources of evidences are as follows:
Evidences of Climate Change
Climate scientists have been constantly engaged in gathering information on key parameters of climate that indicates that some of these parameters have been unequivocally reflect warming of climate. These evidences are gathered from various sources for last hundred years as well as in extensive details for the last two to three decades. Various sources used for gathering such information are innumerable weather stations across the globe, satellites, ships, aircrafts, weather balloons and buoys. These evidences are collated and trend analysis has been undertaken by numerous scientists engaged at national and international level.
At the international level, these researches are compiled and global trends have been reported by the Intergovernmental Panel on Climate Change (IPCC) in the form of Assessment Reports. IPCC since its origin in 1988, has already been published these assessment reports. So far, five reports have been published in chronological order. The latest Fifth Assessment Reports have been published between September 2013 and April 2014. For details about IPCC and its reports, you can refer its website http://www.ipcc.ch.
As mentioned above, there are certain parameters that provide indication of warming of climate. Some of these indicators are as follows:
- Increasing temperatures over land and ocean surfaces;
- Melting glacial ice and sea ice;
- Rising sea level; and
- Increasing humidity. (Christopherson and Birkeland, p. 316)
Let us have a detailed discussion on these indicators of climate change in the following section.
Figure 2: Global Temperature Change 1880-2004

a. Increasing Temperatures over Land and Ocean Surfaces: If we analyse temperature data in terms of hemisphere since 1880, it has been observed that the years with the warmest land-surface temperatures were 2005 and 2010 in the Northern Hemisphere. In the Southern Hemisphere, 2009 was the warmest. It has also been observed that the period from 2000 to 2010 was the warmest decade since 1880 Refer to Figure 2). The data from long-term climate reconstructions of temperature point to the present time as the warmest in the last 120,000 years. These reconstructions also suggest that the increase in temperature during the twentieth century is extremely likely (within a confidence interval of greater than 95%–100 %) the largest to occur in any century over the past 1000 years. Record-setting summer daytime temperatures are being recorded in many countries.
According to National Oceanic Administration of America (NOAA) oceantemperatures have also been rising. According to NOAAsea surface temperatures increased at an average rate of 0.07 C° (0.13 F°) per year from 1901 to 2012 as oceans absorbed atmospheric heat. This rise is reflected in measurements of upper-ocean heat content, which includes the upper 700 m (2296 ft.) of ocean.
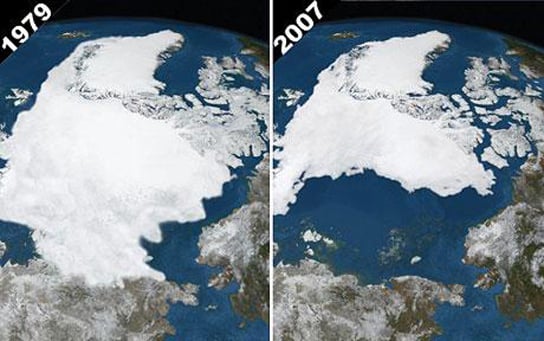
b. Melting of Glacial and Sea Ice: You might have read in the newspapers, magazines or heard from TV, Radio etc. that glacier in Greenland and Antarctica have been receding due to fast rate of melting.Is this a fact? If yes, what are the reasons responsible for such situation? As discussed in the previous paragraph that there has been increase in surface temperature both at land and sea.This rise in temperature has a direct relationship with the melting of glacial and sea ice.
As temperatures rise in Earth’s atmosphere, glaciers are losing ice mass, shrinking in size. This process is known as glacial retreat. Earth’s two largest ice sheets, in Greenland and Antarctica, are also losing icemass. This is evident from the satellite records. Analysis of satellite data of July 2012 revealed that 97% of the ice sheet’s surface was melting. This was the greatest extent in the 30-year record of satellite measurements. Another analysis related to summer melt of the Greenland ice sheet has also revealed that it has increased 30% from 1979 to 2006. On the basis of these evidences, scientists now estimate that between one-and two-thirds of Arctic permafrost will thaw over the next 200 years. As you know, these permafrost reserves took thousands of years to form.
Similar kind of observation has also been noticed in relation to sea ice. Maximum sea ice cover in the world is found in the Arctic Sea. The extent of Arctic Sea ice varies over the course of a year. Every summer, some amount of sea ice thaws whereas in winter, the ice refreezes. It has been observed with the help of satellite data that the minimum extent of summer sea-ice occurs in September whereas maximum extent of winter sea-ice occurs in the months of February or early March. However, analysis of satellite datarevealed that this has declined since 1979(Refer to Figure 3). September sea ice is declining at a rate of 11% per decade incomparison to the 1979– 2000 average and reached its lowest extent in the modern record in 2012. The accelerating decline of summer sea ice, in association with record losses of sea ice in 2007 and 2012, suggests that summer sea ice may disappear sooner than predicted by most models.Some scientists have also estimated an ice-free summer Arctic Ocean within the next few decades.
Figure: Shrinking of Glacial and Sea Ice 1984-2012

Source: https://scitechdaily.com/images/arctic-sea-ice-comparison.jpg
c. Rising Sea-Level: This is another important indicator of climate change. It has been observed that sea level is rising more quickly than the prediction simulated by most of the climate models. During the last century, sea level rose 17–21 cm (6.7–8.3 in.). However, this rise is not uniform across the globe. A greater rise has been observed in some areas like Atlantic coast of U.S. than at any time during the past 2000 years. How did the scientists arrive at such conclusion?Do you have any idea about the tools used for assessing the rise in sea level? Generally we use tidal gauges and satellites to generate such kind of data. Tidal gauge records from 1901 to 2010 show that sea level rose at a rate of 1.7 mm (0.07 in.) per year. Satellite data for the period 1993 – 2013 show that sea level rose 3.16 mm (0.12 in.) per year. This rise is primary due to two major factors that are presently contributing to sea-level rise. About two-thirds of the rise comes from the melting of glaciers and ice sheets whereas the rest one third comes from the thermal expansion of seawater due to absorption of atmospheric heat and expand in volume.
d. Increasing Humidity and Extreme Events: It has been observed that global average specific humidity has increased by about 0.1 g of water vapour per kilogram of air per decade since 1973. This change is consistent with rising air temperatures, since warm air has a greater capacity to absorb water vapour. A greater amount of water vapour in the atmosphere affects weather in a number of ways and can lead to “extreme” events involving temperature, precipitation, and storm intensity. According to the World Meteorological Organization, the decade from 2001 to 2010 showed evidence of a worldwide increase in extreme events, notably heat waves, increased precipitation, and floods. However, to establish a strong linkage betweentrends related to extreme weather and climate change requires data for a longer timeframe than what is now available.
These above mentioned change havedifferential impacts in terms of geographical locations, sectors of economy and socio-economic groups. Therefore, some of the major impacts/ consequences of climate change are mentioned for two levels. One is at macro scale i.e. at global level and the other at micro-level i.e. at national level.
Some of the major observations of Fifth Assessment Report (2013) by IPCCare given below:
Observations of Changes in Climate at Global Level
Some of the highlights of the 5th Assessment Report are as follows:
- Each of the last three decades has been successively warmer at the earth’s surface than any preceding decade since 1850.
- Ocean warming dominates the increase in energy stored in the climate system, accounting for more than 90% of the energy accumulated between 1971 and 2010. Further uptake of carbon by the ocean will increase ocean acidification.
- Over the last two decades, the Greenland and Antarctic ice sheets have been losing mass, glaciers have continued to shrink almost worldwide, and arctic sea ice and northern Hemisphere spring snow cover have continued to decrease in extent.
- The rate of sea-level rise since the mid-nineteenth century has been larger than the mean rate during the previous two millennia. Over the period 1901–2010, global mean sea level rose by 0.19 m (0.6 ft).
- The atmospheric concentrations of carbon dioxide (CO2), methane, and nitrous oxide have increased to levels unprecedented in at least the last 800,000 years, primarily from fossil-fuel emissions and secondarily from net land-use-change emissions. The ocean has absorbed about 30% of the emitted anthropogenic carbon dioxide, causing ocean acidification.
- Total radiative forcing is positive and has led to an uptake of energyby the climate system. The largest contribution to total radiative forcing is caused by the increase in the atmospheric concentration of CO2 since 1750
- Warming of the climate system is unequivocal. Many of thetemperature changes observed since the 1950s are unprecedented over decades to millennia. It is extremely likely (95%–99%) that human influence has been the dominant cause of the observed warming since the mid-twentieth century.
- Climate models have improved since the Fourth Assessment Report. Models reproduce observed continental-scale surfacetemperature patterns and trends over many decades, including the more rapid warming since the mid-twentieth century and the cooling immediately following large volcanic eruptions.
- Continued emissions of greenhouse gases will cause further warming and changes in all components of the climate system. Limiting climate change will require substantial and sustained reductions of greenhouse gas emissions.
- Changes in the global water cycle will not be uniform. The contrast in precipitation between wet and dry regions and between wet and dry seasons will increase
- Global mean sea level will continue to rise. The rate of sea-level rise will very likely exceed that observed during 1971–2010, due to increased ocean warming and increased loss of ice mass from glaciers and ice sheets.
Source: Climate Change 2013, The Physical Science Basis, Summary for Policy Makers, Working Group I, Contribution to the Fifth Assessment Report of the IPCC.
Observations of Changes in Climate at National Level
In India, Ministry of Environment, Forest and Climate Change is the nodal agency whichhas been sending reports to UNFCC. Till now, it has already sent two reports titled as India’s First and Second National Communications to the United Nations Framework Convention on Climate Change in 2004 and 2012 respectively. Let us discuss briefly about these reports.
The future impacts of climate change, identified by the Government of India’s National Communications (NATCOM) in 2004 include:
- Decreased snow cover, affecting snow-fed and glacial systems such as the Ganges and Brahmaputra. About70% of the summer flow of the Ganges comes from melt water
- Erratic monsoon with serious effects on rain-fed agriculture, peninsular rivers, water and power supply
- Drop in wheat production by 4-5 million tonnes, with even a 1ºC rise in temperature
- Rising sea levels causing displacement along one of the most densely populated coastlines in the world, threatened freshwater sources and mangrove ecosystems
- Increased frequency and intensity of floods. Increased vulnerability of people in coastal, arid and semi-arid zones of the country
- Studies indicate that over 50% of India’s forests are likely to experience shift in forest types, adversely impacting associated biodiversity, regional climate dynamics as well as livelihoods based on forest products.
Indian Network for Climate Change Analysis (INCCA) in the recently released report titled “Climate Change and India: A 4×4 Assessment – A Sectoral and Regional Analysis for 2030s” assess differential impacts on the basis of observed climate change and climate change projections for the year 2030s on selected sectors such as water resources, agriculture, forests and human health of selected four distinct geo-ecological regions of India that are sensitive to climate change. These regions are the Himalayan region, North-Eastern region, Western Ghats and Coastal regions.
According to the report “The choice of the sectors and regions is in conformity with the significance and importance of the climate sensitive sectors of the economy that cover the wellbeing and livelihoods of the large population residing in these regions” (INCCA 2010, p.12). But the complete extent and level of climate change impacts on India are still to be studied because it is very diverse and complex in nature. This is because vulnerability to climate change increases due to “low adaptive capacity to withstand the adverse impactsof climate change due to high dependence of the majority of the population on climate-sensitive sectors like agriculture and forestry, poor infrastructure facilities, weak institutional mechanisms and lack of financial resources” (Shukla et al. 2003, p.13).
Summary and Conclusions
Climate change refers to a change in climate which is attributed directly or indirectly to human activity that alters the composition of the global atmosphere and which is in addition to natural climate variability observed over comparable time period. Major natural sources of climate change are solar variability, changes in Earth’s orbit and tilt, plate tectonics, and biological evolution.Various anthropogenic activities lead to emissions of four principal greenhouse gases: carbon dioxide, methane, nitrous oxide and the halocarbons. These gases accumulate in the atmosphere and have increased with the passage of time.
The increase in greenhouse gases within a small period of human history is a problem since it has adverse and differential impacts on different sectors and region. Some of the adverse impacts would be: melting of ice cap, rise in sea level, submergence of many island countries and densely populated coastal areas,increasing frequency of extreme weather events etc.
There are certain global parameters that provide indication of warming of climate. Some of these indicators are increasing temperatures over land and ocean surfaces; increasing sea surface temperature and ocean heat content; melting glacial ice and sea ice; rising sea level; increasing humidity and increase in extreme events.
In India, Ministry of Environment, Forest and Climate Change is the nodal agency which has been sending reports to UNFCC. Till now it has already sent two reports titled as India’s First and Second National Communications to the United Nations Framework Convention on Climate Change in 2004 and 2012 respectively.
| you can view video on CLIMATE CHANGE: EVIDENCES AND CAUSES |
References
- Christopherson, R. W. and Birkeland, G. H. 2015. ‘Chapter 11 Climate Change” in Geosystems An Introduction to Physical Geography, Harlow, England: Pearson Education Limited
- INCCA. 2010. Climate Change and India: A 4×4 Assessment – A Sectoral and Regional Analysis for 2030’s. Ministry of Environment and Forest, Government of India, New Delhi
- IPCC, 2013.Summary for Policymakers. In: Climate Change 2013: The Physical Science Basis. Contribution of Working Group I to the Fifth Assessment Report of the Intergovernmental Panel on Climate Change [Stocker, T.F., D. Qin, G.-K. Plattner, M. Tignor, S. K. Allen, J. Boschung, A. Nauels, Y. Xia, V. Bex and P.M. Midgley (eds.)]. Cambridge University Press, Cambridge, United Kingdom and New York, NY, USA.
- Shukla, P. R., Subodh, K. S., Ravindranath, N. H., Garg, A. and Bhattacharya, S. 2003. Climate Change and India: Vulnerability Assessment and Adaptation, Hyderabad: University Press (India) Pvt. Ltd.
- Ahrens, C.D. 2003. Meteorology Today: An Introduction to Weather, Climate, and the Environment. 7th Edition. Thomson Learning.
- Allegre, C.J. and S.H. Schneider 1994. The evolution of the earth. Scientific American Oct.: 66-75.
- Barry, R.G. and R.J. Chorley (2016) Atmosphere, Weather and Climate, Routledge: New York.
- Chandrasekar, A. (2010): Basics of Atmospheric Science; PHI Learning Private Limited.
- Critchfield, H.J. (2011) General Climatology, Phi Publication.
- Fredrick, K.L and Edward J.T: Atmosphere; Prentice-hall of India PVT, New Delhi.
- Lal, D.S: Climatology, C.S Jian for Chaitanya Publishing.
- Miller, A. and R.A. Anthes (1980) Meteorology, Columbus Publication: Ohio.
- Siddhartha, K. (2014) Atmosphere, Weather and Climate; A text book on Climate; Kisalaya Publication Pvt. Ltd.
- Strahler, A.N. (1965) Introduction to Physical Geography, Willey: New York.
- Strahler, Alan H. and Arthur Strahler. 2003. Physical Geography: Science and Systems of the Human Environment. John Wiley and Sons, New York.
- Strahler, Alan, and Zeeya Merali. 2008. Visualizing Physical Geography. New Jersey: JohnWiley & Sons, Inc.
Web References
- http://www.geographynotes.com/essay/essay-on-cyclones/828
- http://www.physicalgeography.net/fundamentals/7s.html
- http://www.publishyourarticles.net/knowledge-hub/articles/notes-for-understanding-the-polar-front-theory/3030/
- https://en.wikipedia.org/wiki/Extratropical_cyclone https://study.com/academy/lesson/the-polar-front-theory-of-cyclogenesis.html
- https://www.pmfias.com/temperate-cyclones-extra-tropical-cyclones-mid-latitude-cyclones-frontal-cyclones-geography-upsc-ias/