30 PROGRESS IN CLIMATOLOGY: SATELLITE CLIMATOLOGY AND GIS
Dr. (Mrs.) Satya Raj

Introduction
Learning Objectives
Technological Progress in Climatology
Remote Sensing Basics
Types of Satellites
Satellite Remote Sensing for Climatology
Satellite Remote Sensing for Weather Forecasting
Climatology and Geographical Information System
Basics of GIS
GIS Applications in Several Areas
Summary and Conclusion
References
Web Links
Multiple Choice Questions
Introduction
In this course so far, you have learnt about the history of climatology and the general conditions of the atmosphere and its circulation. You have also learned about the phenomenon that leads to various weather events which might be even the extreme ones like floods, cyclones, thunderstorms, etc. You may also recall climatic classifications given by scholars like Koeppen and Thorthwaite.
In this module, you will learn about the progress in the field of climatology with special reference to satellite climatology with the help of remote sensing. You will also get acquainted with the process related to the collection, storage, manipulation, analysis and retrieval of weather related data with the help of Geographical Information System (GIS).
Learning Objectives
After studying this module, you should be able to:
§ define satellite climatology and GIS;
§ explain about the technological progress in climatology;
§ state the basics of remote sensing;
§ distinguish between geo-synchronous and sun-synchronous orbits;
§ describe the importance of satellite climatology for weather forecasting; and
§ summarise the final representation of climatological data on a GIS platform and its applications in various fields.
Technological Progress in Climatology
Today, technological progress in climatology is attributed to the use of remote sensing and GIS in climatology and meteorology. These have revolutionized the climate related studies and deals with the variables which are spatial in nature. Both the technologies, that is remote sensing and GIS are correlated as remote sensing helps us to sense our area of interest from a distant place while GIS helps in the storage, analysis and final display of the required data. The progresses can be grouped into different stages. In very brief, they are:
Infantile Stage: Prior to the advent of satellite data and GIS technology, most of climatic data was collected with the help of ground survey. Weather forecasting must have been done in the primitive times too with the help of certain basic observations like wind direction, cloud colour, sky colour, position of planets and satellites, etc. However, systematic weather forecasting is being done for the last 100-125 years.
Beginning of Takeoff Stage: Dissemination of weather information was facilitated with the invention of telegraph in the year 1840. It helped in the collection and propagation of weather data and reports to each and every parts of the world. Systematic collection and dissemination of weather related information with the help of telegraph took two more decades and was started in England in 1860. Pioneers among the weather telegraphy were Robert Fitzroy, Urbain Le Verrier of France and Smithsonian Institute located at Washington DC, USA. Amongst them Robert Fitzroy was a British meteorologist and captain of HMS Beagle, who sailed around the world with Charles Darwin onboard as a Naturalist. It took another decade for other countries to establish their weather forecasting services.
The period 1900 to 1920 marks the second phase of the progress in climatic data collection and weather forecasting. This was because of the advent of radiotelegraphy. With the help of this ships and aeroplanes equipped with radio and standard weather instruments could collect weather related data from oceans and upper atmosphere respectively.
Takeoff Stage: By 1930, it became possible to measure the atmosphere upto 6-7 km altitude with the help of air-craft sounding technique. Still at higher altitudes, techniques like radio and sound wave propagation, observations of auroras, solar particles and cosmic rays were done to collect atmospheric data.
The 1940s and 50s marks the application of radar for determining upper winds accurately as well as tracking tropical cyclones, thunderstorms and other extreme weather events. During this period rockets were also launched which could easily collect information upto 400 km altitude. So, with this it became easier to explore upper layers of atmosphere.
Steady State Progress: With the advent of satellite climatology, climatic data is obtained through satellites which covers a wider area that needs to be studied and also provides valuable information related to our atmosphere with utmost ease. Today satellite climatology has become an important branch of climatology. The first meteorological satellite, TIROS 1 was launched by United States in 1960.
The invention of high speed electronic computers also revolutionized the method of analyzing climatic data. It helped to solve various complex mathematical problems with ease which is very important in various weather predicting models.
Now first of all understand the basics of remote sensing in brief in the next section.
Basics of Remote Sensing
We can define remote sensing as the art as well as science of obtaining information about an object, area or phenomenon through an analysis of the data acquired by a device which is not in contact with the object, area or phenomenon under investigation. In climatology, the information to be collected includes location and the development of weather systems such as clouds, rainstorms, tropical cyclones, cold and warm fronts, etc. For remote sensing, we need a physical carrier which carries information from the object to the sensor. This carrier is electromagnetic radiations. Electromagnetic radiation is a form of energy and includes radio waves, microwaves, infrared, visible light, ultraviolet, X- rays and gamma radiation. It consists of inseparable oscillating electric and magnetic fields that are always mutually perpendicular to each other and to the direction of propagation. So they propagate in the form of wave at the speed of light through the vacuum.
There are areas of the electromagnetic spectrum where the atmosphere is transparent (little or no absorption of radiation) to specific wavelengths. These wavelength bands are known as atmospheric “windows” since they allow the radiation to easily pass through the atmosphere to Earth’s surface. The atmosphere is practically transparent in the visible region of the electromagnetic spectrum and therefore many of the satellite based remote sensing sensors are designed to collect data in this region. Some of the commonly used atmospheric windows are 0.4 – 0.7 µm (visible), 0.7 -3.00 µm (near infrared and middle infrared) and 8.00 -14.00 µm (thermal infrared). In the visible and near infrared band, sunlight is predominantly reflected. In the thermal infrared band, the main source of radiation as the name suggests, is the blackbody thermal mechanism as every object (water, soil, vegetation, rocks, etc) above absolute zero (- 273oC or 0 K) emits electromagnetic radiation. The microwave portion of the spectrum consists of longer wavelengths (1mm to 1m) and can penetrate the clouds, haze, snow, rain, etc. and thus form a valuable region of remote sensing.
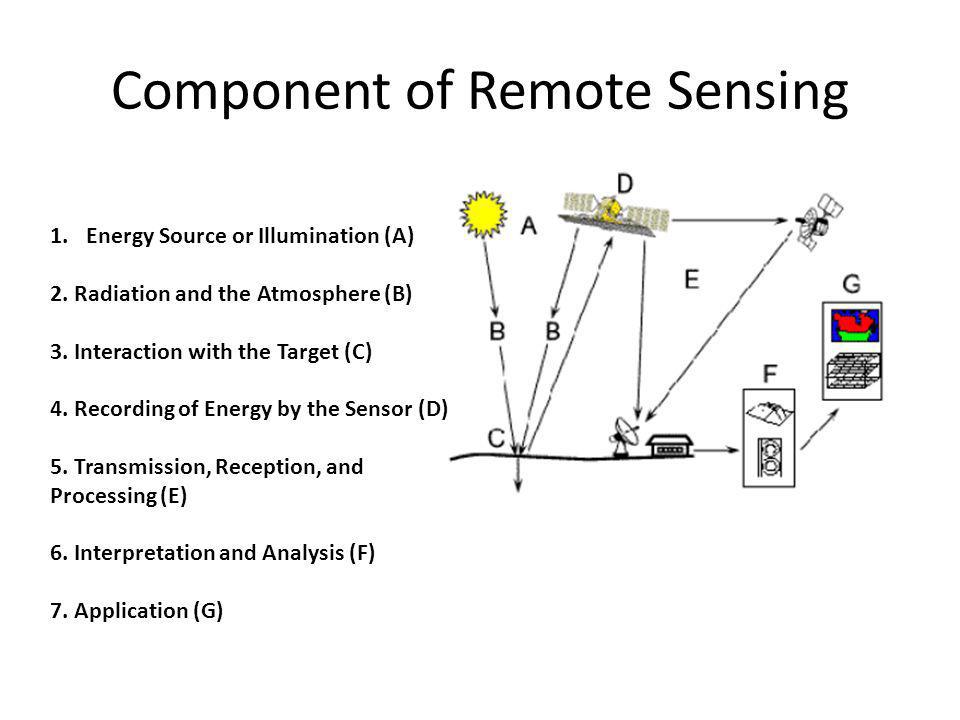
The data acquisition process in remote sensing comprises few distinct elements as shown in Figure 1. They are (i) energy sources (A), (ii) propagation of energy through the atmosphere (B), (iii) energy interactions with earth’s surface features (C), (iv) airborne/space borne sensors to record the reflected energy (D), (v) generation of sensor data in the form of pictures or digital information (E), (vi) examining the data using various interpretation devices to analyse pictorial data and (vii) Final compilation of data for various applications.
Figure 1: Remote Sensing Basics

(Source: http://slideplayer.com/slide/236364/1/images/4/Component+of+Remote+Sensing.jpg)
So we have learnt that a satellite sensor not only receives electromagnetic radiation emanating from the objects, but also receives the reflected radiation from an external source by the same object. This external source of radiation can be sun which is a natural source and accounts for most of the electromagnetic energy recorded by remote sensing systems.
The sun can be regarded as a 6000 K blackbody. The total emitted radiation from a blackbody (Mλ) is measured in Watts per m-2 and is proportional to the fourth power of its absolute temperature (T) measured in degrees Kelvin. This is known as the Stefan- Boltzmann law and is expressed as:
Mλ = σT4
Where:
σ is the Stefan Boltzmann constant, 5.6697*10-8Wm-2K4. So as the energy emitted by any object is a function of its temperature. The greater the temperature, the greater the amount of radiation from the object.
Another external source of radiation can be the satellite itself which illuminates up the object to be studied and receives the reflected radiation from the object. This gives rise to active and passive remote sensing.
When a satellite sensor generates its own energy to illuminate the surface and records that reflected energy from the target objects, it is called an active remote sensing. These radiations operate in microwave region of electromagnetic spectrum and include wavelengths longer than 1mm. So active remote sensors are not dependent on the solar energy as the illuminating source.
Passive remote sensing basically depends on solar radiation as the source of illumination. it operates in visible and infrared region of electromagnetic spectrum. Refer to Figure 2 to get a clear understanding of active and passive remote sensing.
Figure 2: Active and Passive Remote Sensing

(Source: https://i2.wp.com/grindgis.com/wp-content/uploads/2017/05/image_thumb-16.png?resize=624%2C397)
Now let us get acquainted with satellites and different types of weather satellites
Satellite: A satellite is an object put into orbit around the earth or any other planet in order to relay communication signals or transmit scientific data. Basically, there are two types of weather satellites, namely sun synchronous and geosynchronous satellites. The sun-synchronous satellites are much lower in altitude than the geostationary satellites. The path followed by a satellite is referred to as its orbit. Now let us get some more acquaintance about this.
Types of Satellites
So far you know that an object in orbit is called a satellite. It can be a natural satellite like earth’s moon or human made satellite that are employed to collect climatic data or used for communication or navigational purposes. Based on different orbits, altitudes and inclination of the orbital plane with the earth’s equatorial plane, there are basically two types of weather satellites. They are:
A. Polar Satellites
B. Geosynchronous or Geostationary Satellites
Now let us know about them.
Polar Satellites
Polar or more appropriately near-Polar orbits have an inclination near 90o. The satellites orbiting in these orbits follow a circular orbit from pole to pole. So they are capable of seeing every part of the earth in a cycle of the satellite. It can be understood from Figure 3. These satellites are basically inserted into sun-synchronous orbits which place the spacecraft in a relatively constant relationship to the sun. It enables the satellite to pass over a section of the earth at the same time (that is, local time of the place) of the day. This satellite is very useful for predicting weather and also acts as a surveillance satellite. They orbit at an altitude of about 700-800 km and it takes about 100 minutes for these satellites to orbit the earth. So they complete about 14 orbits in a day. Since the earth is rotating beneath the satellite, the satellite passes over a different longitude each time it goes around the earth, i.e., the satellites see a new swath of earth on every orbit as shown in Figure 3.
Figure 3: Sun-Synchronous Orbit

Source: https://earthobservatory.nasa.gov/Features/OrbitsCatalog/images/sun-synchronous.png
Geosynchronous or Geostationary Satellites
These satellites orbit the earth at the same rate as the earth spins. So its orbital period is equal to one sidereal day (23 hours, 56 minutes and 4.09 seconds). Its orbit is at an altitude of about 36,000 km above the earth. In order to maintain a constant height and equilibrium, these satellites are located over the equator. This is because, above the equator there is a constant force of gravity from all directions. These satellites are capable of viewing an entire hemisphere at a time. Most of the satellite images shown on weather channel are through these satellites. They are helpful in studying the extreme weather events like cyclones on a large scale. They are also used as communication satellites.
Difference between Geosynchronous or Geostationary Satellites
Now let us understand the difference between the geosynchronous and geostationary satellites. A geostationary satellite is having no eccentricity and has zero inclination.
The orbital eccentricity of an astronomical object is a parameter that determines the amount by which its orbit around another body deviates from a perfect circle. A value of 0 is a circular orbit, values between 0 and 1 form an elliptical orbit, 1 is a parabolic escape orbit, and greater than 1 is a hyperbola. On the other hand, inclination of a satellite’s orbit refers to the angle at which it crosses the equator.
This enables the satellite to stay over the same point of the earth’s equator as if it is stationary in the sky. When these satellites are given a small eccentricity and inclination, they become geosynchronous. So, to an observer on earth, every day the satellite will appear in its orbit at the same place in the sky at the same time of the day. They make tiny figure “eights” in the sky instead of staying stationary like geostationary satellites at a particular place. Communication and surveillance satellites basically make use of geosynchronous satellites which has a small eccentricity and inclination in order to ignore small perturbations of satellites due to natural causes. Due to this ground antennae are able to see a comparatively larger area of the sky so that if the satellite stays within that area, communication is retained. Refer to Figure 4 to understand the difference between geo-synchronous and geostationary orbits.
Figure 4: Geosynchronous and Geostationary Orbit

Source: https://www.quora.com/What-is-the-difference-between-geostationary-and-geosynchronous-orbits
In this module so far, you have studied in brief about remote sensing, different types of weather satellites and its basics. Now, let us study about satellite remote sensing for climatology, especially for weather forecasting.
Satellite Remote Sensing for Climatology
Satellite Remote Sensing is increasingly gaining importance in providing data for inaccessible regions in lesser time with the help of high resolution imageries. It provides climate variables with a large regional coverage even up to global coverage. Currently land surface temperature maps can be prepared by combining a DTM (Digital Terrain Model) with brightness temperatures derived from METEOSATs (Meteorological Satellites) thermal infrared channel. With the help of these techniques even evapotranspiration maps can be prepared. Apart from providing information about atmospheric combination, land use and land cover change can be done quite effectively with the help of satellite imageries. A change in land use and land cover can in turn bring change in different climatic variables like temperature, pressure, wind direction, amount of rainfall, etc.
Satellite Remote Sensing for Weather Forecasting
You will study about weather forecasting in detail in module 39 of this course. However, let us get a brief introduction to satellite remote sensing and weather forecasting in this module. You have already been introduced to satellite climatology which received a wide recognition after the launch of the first meteorological satellite TIROS-1 (Television Infra Red Observational Satellite-1) in 1960 by United States. With this, several developments took place like the use of radars, weather satellites, high configuration computers, statistical and computer models in weather forecasting. We have already been acquainted with sun-synchronous and geo-synchronous satellites. Some of the examples of geostationary meteorological satellites are GMS (Geostationary Meteorological Satellites), FY-2 (Fen Yun 2), GOMS (Geostationary Operational Meteorological Satellite), INSAT (Indian National Satellite System), INDOEX (Indian Ocean Experiment), METEOSAT (Meteorological Satellites), GOES E (Geostationary Operational Environmental Satellite East), GOES W (Geostationary Operational Environmental Satellite West) etc. On the other hand, examples of polar orbiting satellites are NOAA (National Oceanic and Atmospheric Administration) series, FY-1 (Fen Yun- 2) Series, TRMM (Tropical Rainfall Measuring Mission), QuickSCAT (Quick Scatterometer), etc.
Thus we see that apart from several weather instruments, climatic data and measurements are also taken with the help of satellites and its sensors. So, what is the difference between data generated from conventional weather instruments and those from satellites? The answer to this is that the conventional weather instruments like Anemometers (measuring wind), Barometer (measuring pressure), rain gauges (recording rainfall), etc. can only take measurements locally, that is, for a very limited area. While satellites, being placed at a distance, are able to take measurements for a relatively larger area. GOES (Geostationary Operational Environmental Satellite) because of their high altitudes are capable of recording upper air meteorological data. Geostationary satellites provide continuous monitoring while polar orbiting satellites views most of the earth twice, in a 24-hour period, one during day time and one in darkness. The data provided by these satellites is relevant for study of weather system dynamics. In a way, a global system of space observations with both geostationary and polar orbiting satellites has evolved.
NOAA (National Oceanic and Atmospheric Administration) is a polar satellite of low altitude and has various sensors meant to take different observations. Some of them are mentioned below along with their functions:
Earth Radiation Budget (ERB): It measures the energy budget of atmosphere and earth.
Total Ozone Mapping Spectometer (TOMS): It obtains data regarding ozone.
Solar Backscatter Ultraviolet Energy (SBUV): It monitors and evaluates the atmospheric ozone.
Stratospheric and Mesospheric Sounder (SAMS): It records the temperature of the atmosphere.
GOES (Geostationary Operational Environmental Satellites) Imager: It records solar radiation and energy reflected by the earth’s surface.
Now, let us learn about the importance of Geographical Information System in Climatology (GIS).
Climatology and Geographical Information System
GIS has evolved as a powerful management tool for capturing, modelling, analysing and displaying climatological data. In order to understand things better, first let us learn about the basics of GIS in brief.
Basics of GIS
A Geographical Information System or GIS is a computer system for capturing, storing, querying, analyzing, retrieving and displaying the geospatial data. Components of GIS include hardware, software, network, data, people and procedures. Geospatial data is also called geographically referenced data and describe both geographical location and attributes of different entities. The geographical location gives the coordinate information (x,y) on a plane coordinate system or the information about the longitude (x) and latitude (y) of any entity. Spatial information also relates to their geometry or shape. Whereas attributes of the geospatial features includes their properties or characteristics which distinguishes one entity from the other. Refer to Figure 5 to see different spatial or geometrical features (map) as well as their attributes represented on respective tables.
Figure 5: Spatial and Attributes Data in a GIS

Source: http://mjcetce409.blogspot.in/2015/10/diagram-depicting-linkage-between.html
As a student of geography, you should know about projections. They are also important in GIS as we deal with maps. So projection is a process that transforms the earth’s spherical surface to a plane surface. However, it is also true that this transformation leads to some distortion and there are so many plane coordinate systems that have been in use to preserve the spatial properties to some extent. To align with one other spatially, different map layers must be based on the same coordinate system. You can refer to Figure 6 to see how different layers are overlaid on one another just because they happen to have the same coordinate system and projection and all layers are finally integrated at the end.
Figure 6: Different Layers integrated in a GIS

Source: https://natgeoeducationblog.files.wordpress.com/2014/07/32282.jpg
Spatial data in GIS has two primary formats or models, that is, raster and vector data model. Vector data model uses points and their x,y coordinate information to construct features like points, lines and polygons and appear very much like a map. Any thematic map is represented with the help of point, line and polygon features arranged in different layers on a map. Raster data model on the other hand generalises the scene into a grid of cells, each with a code to indicate the feature being depicted. The cell is the minimum mapping unit. Refer to Figure 7 to get a clear picture of vector and raster data models.
Figure 7: Vector and Raster Data Models

Source: http://mallit.fr.umn.edu/fr1001/gis_gps/gisdoc.html
Let us now focus ourselves to the importance of GIS in climatology.
GIS combines database technology with computer assisted cartography and it is very useful in representing climatological phenomenon which are naturally spatial variables. It offers a useful platform for the representation and management of vast spatial climatic datasets for a variety of applications. It provides a standard means of overlaying and combining data for analysis.
Climatic data like occurrences of lightning strikes can be represented as points on a GIS map. Similarly isolines like isotherms, isobars, etc. are represented as lines on a vector map. Also Digital Terrain Models (DTMs) are used increasingly for extraction and extrapolation of climatic data especially for high elevation mountainous environments. Raster DTMs are then simplified into TINs (Triangular Irregular Network) from which the microclimate of each triangle or facet is readily calculated via a variety of simple algorithms.
Now let us get acquainted with the application of climatic datasets in several fields.
GIS Applications in Several Areas
These days, GIS has a very wide spectrum for its uses. This helps in understanding the spatial, temporal and spatio-temporal variations in different components. Since they are numerous, only a few climatic or related branches are touched upon very briefly below.
A. Agriculture and Forestry
GIS has a great potential for agroclimatic modelling. A combination of maps containing different layers like soil, nutrients, water stress, fertility maps, etc. can predict the agricultural yield. With the help of temporal remote sensing data along with soil, rainfall and temperature data growing index of a particular crop can be found out. It could also explore the possibility of finding out more suitable regions for growing a particular crop. GIS can also be used to monitor biogenic emissions, agricultural pollution or water stress areas.
Similarly in forestry, GIS can enable us to find out suitable sites for afforestation. GIS can be used for delineating forest zones, mapping of forests paths, model the spread of forest fires, etc. GIS integrated with remote sensing techniques can also be used to monitor forest cover change over time and also model forest recovery.
B. Ecology
GIS based agroclimatic models can be used to model ecological biodiversity with respect to spatial climate datasets. With the help of GIS, the impact of various elements of climate on different species can also be studied.
C. Health and Disease
Various vector borne diseases have geographical indicators especially those related to climate. These can be modelled effectively using a GIS platform in order to control their spread and save the lives of people. Diseases like malaria, dengue and many more are creating a lot of havoc during these days and their geographical indicators need to be properly studied. To find out their possible areas of outbreak so that proper safety measures can be taken in advance, we need to take the help of remote sensing and GIS.
D. Hydrology
GIS plays a great role in hydrological field too. Hydrological parameters like spatial distribution of precipitation, forms and types of precipitation all have a spatial expression which can be represented on a map. Amount of rainfall combined with DTM (Digital Terrain Model) can also be modelled to give an idea about flood forecast. Satellite imageries and GIS maps can also help in the exploration of underground water and also study the change in the groundwater levels.
E. Urban Environment and Transport
Urban environment is rapidly deteriorating due to vehicular traffic congestion and gaseous emissions. Due to industrialisation, production of goods has increased to a great extent but it has also taken a great toll of the ambient air quality of urban environment. Suspended particulate matter (SPM) is creating atmospheric haze by obscuring the adequate sunlight especially during the winter months and leads to several respiratory or lung related diseases in human beings. It is creating adverse effects on other living organisms as well.
GIS can act as an inventory of emissions and also model them and correlate them with traffic data. GPS (Global Positioning System) can help in automobile navigation and can be used to monitor traffic in integration with GIS. Thus GIS can be used to study pollution and also help in climatic modelling studies. Remote sensing integrated with GIS can help in the study of urban heat islands which is due to heavy concretisation and construction of high rise buildings in urban areas.
F. Climate Change
Climate change refers to any significant change in measures of climate (such as temperature, precipitation or wind) lasting for an extended period (decade or longer). Due to human activities, earth is becoming warmer. As per NASA’s estimates, earth’s average surface temperature has increased by about 1.2 to 1.4o F since 1900. This increase in temperature is attributed to the excessive use of fossil fuels such as coal, petroleum, natural gas, etc. which has increased the levels of greenhouse gases in the atmosphere. These greenhouse gases are responsible for tremendous increase in temperature of earth as they trap the outgoing long wave terrestrial radiation from escaping and thus produce greenhouse effect by raising the temperature of the earth.
GIS has become a visualisation tool for the output of climate models such as general circulation models used to predict the global impacts of hypothesised climate change scenarios. With the help of GIS, one can study the effect of climate change on agriculture and ecology. GIS can also study climate change implication to the health of living organisms, land use land cover change, effects of deforestation, desertification, urbanization, etc.
G. Disaster Monitoring and Management
In the recent years, GIS is used as a tool for management of disasters as it amalgamates geospatial data with socio-economic information for better decision making in handling any disaster. Various governmental agencies and decision-makers are using GIS for better predicting, monitoring and lastly management of disasters. GIS combines various layers of information containing different themes that helps the policy makers in different levels of disaster management, that is in the pre-disaster planning, prediction and early warning of disasters and damage assessment and relief management. Through GIS maps both vulnerable areas and comparative safer areas for disasters can be identified. This would help in evacuating the population from the vulnerable areas and rehabilitating them in the safer areas can be possible. This would also aid in smooth organization of post-disaster operations.
Now recapitulate what we have learnt so far.
Summary and Conclusions
Today technological progress in climatology is attributed to the use of remote sensing and GIS in climatology and meteorology. Prior to the advent of satellite data and GIS technology, most of climatic data was collected with the help of ground survey. Systematic collection and dissemination of weather related information started with the introduction of telegraph technology. With the advent of satellites, climatological data is obtained very easily. It covers a wider area that needs to be studied with fewer efforts. It is cheap, less time consuming and very precise in terms of accuracy. Basically there are two types of weather satellites, namely sun-synchronous and geosynchronous satellites.
Satellite Remote Sensing is increasingly gaining importance in providing data for inaccessible regions in lesser time with the help of high resolution imageries.It provides climate variables with a large regional coverage even up to global coverage. Geostationary satellites provide continuous monitoring while polar orbiting satellites views most of the earth twice, in a 24-hour period, one during day time and one in darkness. The data is relevant for study of weather system dynamics.
GIS is a computer based system for capturing, storing, querying, analyzing, retrieving and displaying the geospatial data. GIS is an organized collection of hardware, software, network, data, people and procedures. Spatial data in GIS has two primary formats or models, that is, raster and vector. GIS combines database technology with computer assisted cartography and is very useful in representing climatological phenomenon which are naturally spatial variables. Climatic datasets in several fields like agriculture, forestry, ecology, urban environment, health, climate change studies, disaster management etc.
| you can view video on PROGRESS IN CLIMATOLOGY: SATELLITE CLIMATOLOGY AND GIS |
References
- Chang, K.T. (2006). Introduction to Geographical Information Systems, McGraw-Hill Higher Education.
- Jensen, J.R. (2006): Remote Sensing of the Environment: An Earth Resource Perspective, Pearson Education, New Delhi.
- Reddy, M.A. (2008): Remote Sensing and Geographical Information System, B.S. Publications, Hyderabad.
Web Links
- Observing Weather: https://www.youtube.com/watch?v=EKWrrkI1xrY (IGNOU SOS video)
- Predicting weather: https://www.youtube.com/watch?v=ZJE2VrdFxDg (IGNOU SOS video
- http://mallit.fr.umn.edu/fr1001/gis_gps/gisdoc.htm
- http://www.osdma.org/ViewDetails.aspx?vchglinkid=GL024&vchplinkid=PL04
- http://www.radio-electronics.com/info/satellite/satellite-orbits/satellites-orbit-definitions.ph
- http://www.satobs.org/faq/Chapter-04.tx
- https://cimss.ssec.wisc.edu/satmet/modules/2_weather_satellites/ws-2.html#ta
- https://earthobservatory.nasa.gov/Features/OrbitsCatalog/images/sun-synchronous.png
- https://earthobservatory.nasa.gov/Features/OrbitsCatalog/page2.ph
- https://natgeoeducationblog.files.wordpress.com/2014/07/32282.jp
- https://www.quora.com/How-sun-synchronous-orbits-differ-from-geo synchronoushttps://marine.rutgers.edu/cool/education/class/paul/orbits2.htm
- https://docs.kde.org/trunk5/en/kdeedu/kstars/ai-blackbody.htm
- https://earthobservatory.nasa.gov/Features/RemoteSensing/remote_04.php
- http://mjcetce409.blogspot.in/2015/10/diagram-depicting-linkage-between.html