6 GLOBAL TEMPERATURE DISTRIBUTION: HORIZONTAL AND VERTICAL
Dr. Ramashray Prasad

Objectives
- define and distinguish between heat and temperature;
- explain differentcontrollingfactorsof temperature;
- describe the temperature conditions during summer and winter;
- illustrate theannualmeantemperature distribution over the globe;
- explain the average annual temperature range over the globe;
- explain the vertical temperature distribution and its inversion and
- describe different types of temperature inversions.
Contents
Introduction
Learning Objectives
Source of Energy on the Earth
Heat and Temperature
Global Temperature Distribution
Principal Controls on Temperature
Latitude
Effect of Atmosphere
Angle of Incidence
Altitude
Length of the Day
Continentality
Winds and Ocean Currents
Aspect
Topography and Vegetation
Horizontal Temperature Distribution
Sun Overhead on the Tropic of Cancer (July)
Sun Overhead on the Tropic of Capricorn (January)
Annual Mean Temperature over the Globe
Average Annual Temperature Range
Vertical Distribution of Temperature
Inversion of Temperature
Ideal Conditions for Temperature Inversion
Types of Temperature Inversion
Ground Inversion
Valley Inversion
Subsidence Inversion
Frontal Inversion
Summary and Conclusions
Multiple Choice Questions
References
Web Links
Introduction
During peak summer days you must have heard people saying that ‘it is too hot’ or during peak winter days you might agree,people saying ‘it is too cold’. Too hot or too cold is referred to heat while people mean it temperature. The quality of hotness or coldness refers to the state of the air which we call ‘heat’. Heat is basically the transfer of thermal energy from one substance to another. This transfer happens due to difference in hotness or coldness. Temperature is different from heat. But sometimes we useheat and temperature as synonyms which is not fair. Temperature of any substance is the degree or intensity of heat available in that body.In fact, temperature is a measure of average heat or thermal energy of the particles in a substance. Its most popular measure is in either degree Celsius or Fahrenheit. You have already studied about the heating and cooling of atmosphere and distribution of insolation over the globe in Module 4 and 5. You must be well aware that the temperature vary substantially. The global distribution of temperature is directly and very closely associated with the distribution of insolation. There are several factors affecting them. The main concern in this module to study the factors controlling the temperature and its global distribution in both – horizontal and vertical perspectives.
Source of Energy on the Earth
The prime source of energy for the earth surface is the sun. It comes in the form of electromagnetic radiation in different wave lengths or bands of electromagnetic spectrum. Some of these bands. Some of these bands (thermal and visible) are heating the earth surface as well as its atmosphere. Another source of energy i.e. geothermal energy from earth’s interior also reaches the surface but its role in temperature distribution is negligible. Therefore, we will discuss about the distribution of temperature received only from the sun.
Heat and Temperature
Heat is a form of energy. It measures the total energy in a volume of a substance retained by all the molecules which we call total kinetic energy. Its measuring units are joule or calorie. The standard unit for the rate of heat transferred is watt, generally defined as one joule per second. Temperature is a measure of degree of hotness or coldness of a substance. In other words, heat represents the molecular movement of particles of a substance while the temperature is the measurement of degree of hotness of the substance. It is the measure of average kinetic energy of the molecules of the substance we are referring to. Refer to the Figure 1A. The water in two containers – a bucket and a cup has the same temperature 250C. The same amount (total energy) of heat (50,000 joule) is provided to both the containers. The water in the cup gets heated more in comparison to the bucket, though the energy given was same (Figure 1A). Remember the definition given above, heat is total energy retained by all the molecules of the substance (water), while the temperature is the average kinetic energy of the substance.
The movement of heat depend upon the temperature difference between two bodies (Figure 1B). Heat always moves from a body of higher temperature to that of lower temperature. Primarily, it is measured in kelvin (K) unit in the study of physical sciences, but most commonly measured in Celsius (C) or Fahrenheit (F) in day to day uses. They are denoted as 0K, 0C and 0F.
Figure 1: Difference between Heat and Temperature (A), Heat Transfer (B)

Temperature in 0C or 0F would be taken into account while describing its distribution and not the kelvin scale of measurement.
Global Temperature Distribution
The global temperature distribution is explained in two ways – horizontal and vertical. But before coming to the direct distribution of temperature over the globe in these two perspectives, it is important to study the factors which control the temperature.
Principal Controls on Temperature
The temperature on the earth surface and in its atmosphere is not alike, but it varies significantly.
The variation is controlled by various factors. Important among them are:
Latitude
Altitude
Length of the day
Continentality
Wind and ocean currents
Aspect
Topography and vegetation
Latitude
Latitude is one of the most important and primary factors affecting the unequal heating of the earth surface and its atmosphere. The intensity of heating determine the degree of temperature on the earth and so is its distribution. Overall annual maximum energy is received on or near the equator. Away from the equator towards poles, the received energy from the sun decreasesand hence the temperature also keeps on declining.
The low latitude areas receive more solar radiation due to two reasons:
a. Effect of Atmosphere: In low latitude particularly near equator, the solar beam of light travels for lesser distances in the atmosphere. Hence, less reflection, less obstruction and less absorption is observed in the atmosphere. This results in greater amount of solar energy receiving on the earth and records higher temperature. On the other hand, in the higher latitude particularly in the polar regions, the reverse conditions prevailand hence, less temperature is recorded (Figure 2).
b. Angle of Incidence: In the low latitude areas, the incidence of sun rays is vertical or near to vertical, and hence the beam of rays (energy) is concentrated to smaller areas. Therefore, the heat received per unit area is higher and thus more temperature is recorded.But in the higher latitude areas, the incidence of sun rays is oblique, and hence, beams of rays spread over larger areas. This leads to less energy received per unit of area, leading to less temperature in the higher latitudes or polar areas (Figure 2).
Figure 2: Angle of Sunrays Incidence

Altitude
Temperature is inversely correlated with altitude. Increase in altitude shows decrease in temperature. You might be remembering (module on insolation) that sun energy heats the earth surface first. The air in its contact is heated and finally the atmosphere gets the heat by different methods. Another reason for more temperature in the lower atmosphere is the presence of more dust particles, water vapour, aerosols, and other solid minute substances in the lower level of the atmosphere. They are also absorbing the incoming solar radiation as well as the terrestrial longwave radiation. In this process, lower atmosphere is relatively warmer in comparison to upper atmosphere which is clean and free from minute solid substances (Figure 3).
Figure 3: Heating of Earth Surface and Air

Source: https://latitudealtitude.weebly.com/how-altitude-affects-temperature.html
Length of the Day
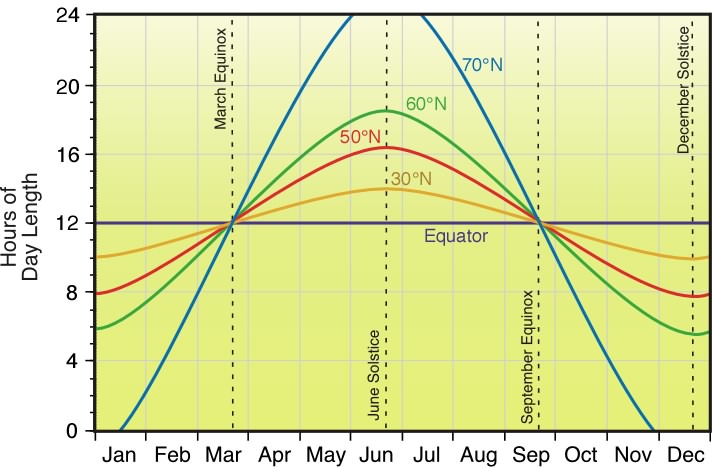
With change in season, length of the day changes and it is due to apparent departure of the incidence of sunrays. In general, more duration of sunlight results into greater amount of energy received. When it is summer time in northern hemisphere, it iswinter time for southern hemisphere. During June, places in northern hemisphere have greater duration of day hours (Figure 4). The sun is vertical on and near the Tropic of Cancer. Therefore,higher temperaturesare recorded around the Tropic of Cancer in June than at the equator. The duration of day at 300N latitude is about 14 hours, while at 500 N, it is more than 16 hours. It is also worth mentioning that that greater acute angle of sunrays in polar areas does not increase temperature effectively even though the duration of days are more than 24 hours. When it is summer time for southern hemisphere, it is winter for the northern hemisphere. During January, it is the reverse case of what it has happened during June.
Figure 4: Duration of Day Length in Northern Hemisphere

Source: http://www.physicalgeography.net/fundamentals/images/daylength.jpg Continentality
Continentality refers to control of landmass on temperature and its range and it depends on distance from sea. As the distance from sea or water bodies’ increases continentality increases it means range of temperature increases. In coastal areas due to maritime influence range of temperature is low. These variations are related to nature of surface or to differential rates of heating and cooling of land and water.Refer to Figure 5, two stations – Dollas (320 51’N) and San Diego 320 44’N) of USA which are situated on the same latitude. San Diego, near the sea coast, has moderate temperatures (not very high and not very low) while Dollas, situated in the interior, has extremesof temperatures (very high in summer and very low in winter). Therefore, the annual range of temperature at San Diego is only 90C while it is 240C at Dollas. The reason is condition of continentality.
Figure 5: High Range of Temperature due to Continentality

Source: http://web.gccaz.edu/~lnewman/gph111/topic_units/temperature1/temperature/04_25.jpg
Winds and Ocean Currents
Winds and ocean currents affect the temperature of any region. Winds are the horizontal movement of air from high air pressure region to low pressure. Ocean currents also transport the heat energy from one region to another. The prevailing winds blowing towards land from the oceans modify the temperature. For example, winds blowing from the warm ocean (tropical region) keep the coast warm while winds blowing from cold (polar region) surface make the coast cold. The same thing happens with the ocean currents because, they also affect as per their characteristics.
Aspect
The temperature at local or regional level is affected by the aspect of the area. Aspect refers to the direction of the place or area especially to the angle of the sunrays it faces (Figure 6A). Due to inclined axis of the earth and its rotation, the sway of the sun is apparently seen between Tropics of Cancer and Capricorn. Beyond these limits, east-west laying mountain’s northern slope in north hemisphere and southern hemisphere in southern hemisphere do not get direct sunlight even at the noon. They have shadows of the mountain while the southern facing slope in the north hemisphere gets direct and almost vertical sun’s rays. In southern hemisphere, northern facing slope gets bright and effective sun’s energy and the temperature is high on the sun facing slopes. The slope away from sun faces chilled conditions during winter as winds coming from poles are very cold. Sun facing slope is protected from cold winds. Sun facing slopes have very good condition for photosynthesis and have very dense vegetation while theon surface away from sun, theideal condition for photosynthesis lacks and so does the vegetation (Figure 6B).
Figure 6A: South and North Facing Slopeswith Respect to Sun

Source: http://www.s-cool.co.uk/gifs/g-geo-climat-dia02.gif
Figure 6B: South and North Facing Slopes in Eastern Bhutan Himalaya

Source: Photograph by Author (Dr. R. Prasad) at Trashigang along Dangme Chu River, Eastern Bhutan
Topography and Vegetation
The term topography refers to the appearance of the surface of any particular area in terms of differences in height like nature created mountains, hills, plains, plateaus, or human created different cultural features. Therefore, various features found on the earth’s surface also affect the temperature as per interactions with incoming solar radiation. The differences in temperature is amplified by the topography, if you compare hot desert with that of vegetative areas or rainforest or grasslands. In the same way, types of soil or vegetation affects the temperature a lot. The alteration of the land cover also alters heating and cooling process in a changed situation. Hence, changes in the soil and vegetation arereflected on the distribution of temperature.
Horizontal Temperature Distribution
The energy coming from the sun is not uniform all through the globe which we have already pointed out in discussion about factors affecting temperature. Due to the effects of severalfactors, incoming energy and temperature are widely varying over the surface of the earth.
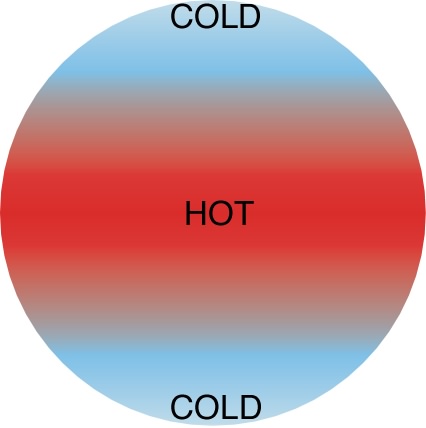
In general, equatorial region is hot and its temperature is high throughout the year. Generally, from equator to polewards, temperature keeps on declining. The lowest temperature is at and near the pole. In other words, the average annual temperature has a gradual decrease towards pole in the beginning from the equator, but after tropical zone, the decrease is accelerated. After the temperate zone, the declining trend in temperature is drastically enhanced (Figure 7A and B). It is all due to locational disadvantages of the poles, far away from the sunlight associated with other factors as explained a little while ago.
Figure 7A and B: Trends of Temperature Decline

Source A: http://www.physicalgeography.net/fundamentals/images/hotcold.jpg
Source B: http://jrohnerweatherandclimate.weebly.com/uploads/4/3/7/1/43713345/9198026_orig.gif
Since the sun is almost vertical in the tropical zone, the annual average temperature varies between 220C to 260C. The 220C is at Tropic of Capricorn, laying in the southern hemisphere. Along Tropics of Cancer, the annual average temperature is 240C (Figure 7B). The reason behind the difference is that, southern hemisphere has more water bodies while northern hemisphere has relatively more continental areas (Figure 8). As explained before, land areas record higher temperature than water bodies. It is due to this reason, temperature difference is observed.
Figure 8: Land-Water Distribution over the Globe

To represent distribution of temperature isotherms are used. Isotherm is an imaginary line joining the places with same temperature. If we draw the isotherm of certain time over the world map, we would be in a position to have spatial pattern of the distribution of temperature. Let us study them with respect to two positions – (i) when the sun is overhead at Tropic of Cancer and (ii) when the sun is overhead at Tropic of Capricorn.
Sun Overhead on the Tropic of Cancer (July)
The sun is overhead at the Tropic of Cancer by the end of third week of June (June 21st) at 23.50N. Entire northern hemisphere witnesses bright sun, greater insolation leading to high temperature throughout. But the maximum average monthly temperature is not recorded in June, but it so in July. Therefore, case of July is taken to study ideal summer month for northern hemisphere. The highest temperature is recorded over large chunk of area comprisingSahara desert of northern Africa and desertic parts of west central Asia. This belt runs from Sahara desert, via Arabia to Thar. The high temperature zone is extended to the Indo-Gangetic plain as well as Tibetan plateau. This zone attracts the monsoon winds as it has intense low pressure due to high temperature. This low pressure zone is characterized by inter tropical convergence zone (ITCZ). From this belt, the temperature is declining northward as well as southward. By the northern end of the Asiatic landmass, the average recorded air temperature is around 40C (Figure 9).
During northern hemisphere summer days, the isotherms turns towards northward over land as it is hotter than water. The condition is reversed on the oceans as the water bodies are not that hot as the land is. Hence, the isotherms turns southward on the oceans of the northern hemisphere. Another low pressure system is developed over the northwestern Mexico and southwestern USA due to more intense record of temperature (Figure 9). The same pattern of isotherms are seen on North American landmass.
Overall, pattern of isotherm is reversed in southern hemisphere, particularly with reference to the direction of bending isotherms on land and water. One very remarkable observation is seen on the isotherm map of July in southern hemisphere. During this period, incidence of sunrays is acute and hence, insolation is less. It is the winter season for southern hemisphere. Isotherms are almost parallel to each other with very narrow spacing. The isothermal gradient is very steep (Figure 9). It is more so over the Antarctic landmass where the temperature is very low.
Figure 9: Temperature Distribution during July

Source:http://mgh-images.s3.amazonaws.com/9780321871770/508902-4-9ISQ2.png
Sun Overhead on the Tropic of Capricorn (January)
The sun is overhead at the Tropic of Capricorn by the end of third week of December(December 21st)at 23.50S. Entire southern hemisphere witnesses bright sun, greater insolation leading to high temperature throughout. But maximum average monthly temperature is not recorded in December, but it is so in January.Therefore, case of January is taken to study ideal summer month for southern hemisphere. Both major continents – South America and Africa are tapered towards south. There is no wide and large landmass in southern hemisphere as compared to the northern. The effects of ocean can be seen very clearly. Relatively, the temperature is recorded less.
The maximum mean temperature of January is about 320C over a small area of western Australian desert. Over South America and Africa, it is around 270C. The area bounded by the 270C isotherm is wide over continents as well as on the Indian Ocean. The same is narrow over western Pacific. Eastern Pacific is cool due to the cold ocean currents. Over the Atlantic Ocean, warm area is confined to small and narrow belt enclosed by 270C isotherm. Both Pacific and Atlantic is are open oceans in comparison to the Indian Ocean. Hence, wider warm belt is seen on map (Figure 10). From this zone, there is declining trend of temperature in both the directions – north and south. The isotherm of 210C covers a large part of the globe. Beyond this isotherm in both hemispheres, isotherms are coming closer and keeps on declining towards both poles (Figure 10). The temperature gradient is increasing. It is greater in the northern hemisphere particularly over the large landmass of Asia and North America. The lowest temperature around -400C is recorded on the polar region of Canada, Iceland and Asian Siberia. Over the northern oceans, isotherms are turned towards pole whereas on landmass their bends are towards south. It is because of the transport of heat from equatorial region to poleward through prevailing winds and ocean currents.
Figure 10: Temperature Distribution during January

Source: http://mgh-images.s3.amazonaws.com/9780321871770/508902-4-9ISQ1.png
Annual Mean Temperature over the Globe
We have already discussed about the distribution of temperature for summer and winter seasons represented by two months – July and January. Since sun is always apparently on move due to rotation of the earth on the inclined axis, there is continuously change in the distribution of temperature on the globe. If we calculate annual mean temperature of the earth and plot the same on the map, it would appear as it is shown in Figure 11. From this figure, it is vivid that the decline of temperature is almost symmetrical in distribution from equator towards poles with slight modification by the prevailing winds and ocean currents.
Figure 11: Annual Mean Temperature over the Globe

Source: https://upload.wikimedia.org/wikipedia/commons/a/aa/Annual_Average_Temperature_Map.jpg
Average Annual Temperature Range
Average annual range of temperature is the difference between mean monthly temperatures of the hottest and the coldest months. We have already discussed about distribution of temperature of two seasons – summer and winter. If the difference is computed between these months, that would give you the difference. Those values are plotted in Figure 12. The values shown with the isotherms are written in degree Celsius. From this figure, it is evident that annual range of temperature is very low in low latitude areas. It is less than 30C or less. This is a narrow belt across Africa and South America in the equatorial region. This belt is much wider on ocean surfaces. As long as we keep on marching towards poles, the annual range of temperature is increasing very sharply. This trend is very drastic in the northern hemisphere. This is due to presence of large landmasses and associated high thermal ranges.Over the large landmass of Siberian region, it reaches to about 600C (Figure 12). The same case is observed with Canadian big landmass but with lesser intensity. But in southern hemisphere, it is not that much great
Figure 12: Average Annual Temperature Range

Vertical Distribution of Temperature
You might have already studied about composition and structure of atmosphere in Module 3 and insolation in Module 5. Here, our concern is to study vertical temperature distribution but only within the troposphere. We would not discuss the distribution of temperature beyond this limit.
In general, temperature declinesupward from surface of the earth in troposphere till its upper limit – tropopause.This decreasing temperature is termed as lapse rate. Generally, it is called normal lapse rate in which air keeps on laying at its place and someone or thermometer moves upward. In this way temperature is measured. This drop is 6.50C/km of ascent. It is also termed as vertical temperature gradient. The normal lapse rate is not always the same but it differs depending upon height, season, latitude or other numerous local factors.
Inversion of Temperature
In certain conditions, temperature is not always declining with increasing altitude but it rises. This situation is known as inversion of temperature. The term, inversion, means opposite to the normal. Since normal is fall in temperature with altitude, under inversion, it rises with increasing height (Figure 13). It happens when the air near surface is cooler than upper air.
Figure 13: Inversion of Temperature

Ideal Conditions for Temperature Inversion
Temperature inversion takes place only under certain conditions. Important among them are:
- There has to be long and cool nights so that earth radiates received solar energy.
- There has to be clear sky so that terrestrial radiation escapes.
- There has to be calm and stable air so that vertical motion in the air is absent.
Types of Temperature Inversion
Primarily, there are several types of inversion of temperature. Important among them are:
- Ground inversion,
- Valley inversion,
- Subsidence inversion and
- Frontal inversion.
Ground Inversion
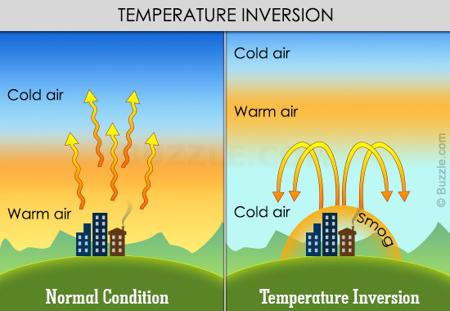
Ground inversion occurs when the surface is cooled rapidly by earth radiation under clear sky. In this way, temperature above the ground is still warmer than air near the ground. When temperature near surface reaches to dew level, the possibility of fog formation increases. Ground inversion is very common in the higher latitude areas or during winter in the plain even in the tropical regions (Figure 14).
Figure 14: Inversion of Temperature on the Ground

Source: http://media.buzzle.com/media/images-en/buzzle/450-temperature-inversion.jpg
Valley Inversion
Valley inversion takes place on the rolling topography, particularly in hilly areas. In such situation, mountain slope becomes cool in the night and the air with its contact gets cooler. Cool air creeps downward along the slope and occupies the valley. The warm air of the valley is pushed up and thus the inversion of temperature is evident (Figure 15).
Figure 15: Inversion of Temperature in a Valley

Source:http://www.islandnet.com/~see/weather/graphics/photos1112/valleyinversoin.jpg
Subsidence Inversion
Subsidence inversion takes place mostly in subtropical high pressure belts or leeward side of the mountain where air subsides. In either of the cases, subsiding air gets warmed in this process while the lower level preexisting air is cooler. The warming is achieved about 100C per km of descending air. Therefore, lower level air seems to be cooler than the plunging air from above. In this situation, the subsidence inversion of temperature is caused (Figure 16).
Figure 16: Inversion of Temperature due to Subsidence

Source A:http://www.earthonlinemedia.com/ebooks/tpe_3e/temperature/subsidence_inversion.png
Source B:http://doorstoarrival.com/wp-content/uploads/2015/08/regional-subsidence-inversion.jpg
Frontal Inversion
As the name suggests that this type of inversion of temperature takes place under the frontal formation of two different air masses. When cold andheavier air mass undercuts warm sector occupied by warm air mass, the warm air is lifted up. The ground is occupied with cold air, and thus, inversion is observed (Figure 17).
Figure 17: Frontal Inversion

Source:https://www.iasmania.com/wp-content/uploads/2016/02/Frontal-Inversion.jpg
Summary and Conclusions
The main source of energy on the earth is sun. It is known as insolation which comes in the form of electromagnetic radiation. Horizontally, it is varying widely. Since temperature is governed by insolation, temperature on earth has wide variations. The variations in the temperature are controlled by several factors. Latitude plays an important role because the angle of incidence of the sunrays and its effectiveness is determined. Altitude also affects distribution of temperature because higher elevation has lower temperature and vice versa. Both – height and temperature are inversely related. Length of the day is determined by other factors as well, but the thumb rule is that, longer the day, greater is the received energy from the incoming solar radiation and hence, more temperature is recorded.However, the incidence of sunrays plays the most effective role. That is why, in spite of long duration of days in the polar region, temperature is very low. Continentality has a very great regulating force to determine temperature. The interior of the continents has extreme temperature records. In summer, they are very hot, but in winter, they are extremely cold. The prevailing winds redistribute temperature over the globe. The same is done by ocean currents. Both of them are modifying temperature in the areas of their influence. The slope and aspect also determinereceiving of energy from the sun. The characteristics of land and its surface along with vegetation have good control over the distribution of temperature.
Overall, horizontal distribution of temperature keeps on declining from equator. During July, when it is summer for northern hemisphere and winter for southern hemisphere, sun is directly shining over Tropics of Cancer and nearby areas, high temperature is recorded there. But in southern hemisphere, temperature is low. Therefore, the highest temperature is over Tropics of Cancer and from here temperature keeps on reducing till poles. The temperature gradient is very strong in the polar areas as isotherms are very close. During July, it is the severest in southern polar areas. During January, summer condition prevails in southern hemisphere, but for northern hemisphere, it is winter. The case of July is completely reversed in January.
The annual range of temperature is very low in equatorial regions as sun is almost vertical or near to vertical throughout the year. The areas in high latitudes experiences very high annual range of temperature. In equatorial region, it is just 30C or less while in polar continental region of Asian Siberia annual range of temperature is over 600C. It is caused by extreme low temperature in winter but in summer, temperature is moderate which makes the difference between two a big one.
Vertically, temperature is on declining trend in general. The drop in temperature is 6.50C/km of ascent from earth surface. It is called normal lapse rate or environmental lapse rate. Under certain conditions the temperature increases with height and it is called the inversion of temperature. There could be different kinds of inversion. Ground inversion take place when the ground is cooled quickly and the warmer air is above. In hilly areas, slope becomes cool and the cool air in its contact creeps downward in valley under the influence of gravity. The preexisting warm air of the valley is pushed up. In subtropical region or subsiding air to leeward side of the mountain gets warmed up by 100C/km of downward movement due to adiabatic warming. The air already existing is cooler than the descending air. When cold air mass undercuts warm sector air of warm air mass, warm air is lifted and the cold air occupy the ground. This type is known as frontal inversion of temperature.
| you can view video on GLOBAL TEMPERATURE DISTRIBUTION: HORIZONTAL AND VERTICAL |
References
- Barry, R.G. and R.J. Chorley (2016) Atmosphere, Weather and Climate, Routledge: New York.
- Chandrasekar, A. (2010): Basics of Atmospheric Science; PHI Learning Private Limited.
- Critchfield, H.J. (2011) General Climatology, Phi Publication.
- Fredrick, K.L and Edward J.T: Atmosphere; Prentice-hall of India PVT, New Delhi.
- Lal, D.S: Climatology, C.S Jian for Chaitanya Publishing.
- Miller, A. and R.A. Anthes (1980) Meteorology, Columbus Publication: Ohio.
- Strahler, A.N. (1965) Introduction to Physical Geography, Willey: New York.
Web Links
- http://doorstoarrival.com/wp-content/uploads/2015/08/regional-subsidence-inversion.jpg
- http://jrohnerweatherandclimate.weebly.com/uploads/4/3/7/1/43713345/9198026_orig.gif
- http://media.buzzle.com/media/images-en/buzzle/450-temperature-inversion.jpg
- http://mgh-images.s3.amazonaws.com/9780321871770/508902-4-9ISQ1.png
- http://mghimages.s3.amazonaws.com/9780321871770/508902-4-9ISQ2.png
- http://s3.amazonaws.com/kidzworld_photo/images/2015826/0c3f5852-fba9-4fcb-963b-94907603b6bf/map-equator.jpg
- http://web.gccaz.edu/~lnewman/gph111/topic_units/temperature1/temperature/temperature2.html
- http://web.gccaz.edu/~lnewman/gph111/topic_units/temperature1/temperature/04_25.jpg
- http://www.earthonlinemedia.com/ebooks/tpe_3e/temperature/subsidence_inversion.png
- http://www.geographynotes.com/earth/the-distribution-of-temperature-on-earth/880
- http://www.islandnet.com/~see/weather/graphics/photos1112/valleyinversoin.jpg
- http://www.physicalgeography.net/fundamentals/7m.html
- http://www.physicalgeography.net/fundamentals/images/daylength.jpg
- http://www.physicalgeography.net/fundamentals/images/hotcold.jpg
- https://academy.gktoday.in/article/distribution-of-temperature-on-earth/
- https://jpscnotes.in/prelims/geography/horizontal-and-vertical-distribution-of-temperature-inversion-of-temperature/
- https://latitudealtitude.weebly.com/how-altitude-affects-temperature.html
- https://ncache.ilbe.com/files/attach/new/20161108/377678/4164420490/9009480854/9df553b4c5edfe2f5f2a9035930c643c.jpg
- https://upload.wikimedia.org/wikipedia/commons/a/aa/Annual_Average_Temperature_Map.jpg
- https://upload.wikimedia.org/wikipedia/commons/thumb/7/75/Oblique_rays.svg/2000px-Oblique_rays.svg.png
- https://www.cssforum.com.pk/css-optional-subjects/group-vii/geography/14066-geography-one-factors-affecting-horizontal-vertical-distribution-temperature.html
- https://www.iasmania.com/wp-content/uploads/2016/02/Frontal-Inversion.jpg
- https://www.pmfias.com/temperature-distribution-earth-heat-budget-heat-balance-seasonal-temperature-distribution/